Making inference using data plots, with application to ecological statistics
Di Cook
Monash University
vISEC
June 24, 2020
https://dicook.org/files/vISEC2020/slides.html
Image credit: Di Cook, 2018
Data plots are utilised widely in ecology, often to make decisions. They can and should be integrated into the classical statistics infrastructure.
I'm going to talk about
I'm going to talk about
inference for data plots
I'm going to talk about
inference for data plots
a high-throughput analysis
I'm going to talk about
inference for data plots
a high-throughput analysis
and computer vision experiments,
Inference for data plots requires
- the plot is a statistic
Inference for data plots requires
- the plot is a statistic
- the type of plot (specified by a grammar) implicitly defines the null hypothesis
Inference for data plots requires
- the plot is a statistic
- the type of plot (specified by a grammar) implicitly defines the null hypothesis
- a null generating mechanism provides draws from the sampling distribution, among which to embed the data plot
Inference for data plots requires
- the plot is a statistic
- the type of plot (specified by a grammar) implicitly defines the null hypothesis
- a null generating mechanism provides draws from the sampling distribution, among which to embed the data plot
- human (computer) observers are engaged to conduct a lineup test
- statistical significance and power can be computed based on the proportion of observers choosing the data plot from the lineup
Why is a plot a statistic?
Many of you (hopefully) use ggplot2 to make your plots with a grammar of graphics.
ggplot(data=DATA) + geom_something( mapping=aes(x=VAR1, y=VAR2, colour=VAR3) ) + extra nice stylingWhy is a plot a statistic?
Many of you (hopefully) use ggplot2 to make your plots with a grammar of graphics.
ggplot(data=DATA) + geom_something( mapping=aes(x=VAR1, y=VAR2, colour=VAR3) ) + extra nice stylingA statistic is a function of a random variable(s). This is how the mapping can be interpreted.
Adding data gives a visual statistic
# Get some datalibrary(amt)data("deer")data("sh_forest")rsf1 <- deer %>% random_points(n=1500) %>% extract_covariates(sh_forest) %>% mutate(forest = sh.forest == 1) %>% rename(x=x_, y=y_, sighted=case_)# Plot itggplot(data=rsf1) + geom_point( aes(x=x, y=y, colour=sighted), alpha=0.7) + extra nice stylingObserved value of the statistic

ggplot(rsf1) + geom_bar( aes(x=sighted, fill=forest), position = "fill") + extra nice stylingFor sighted vs forest habitat the mapping requires call to stat=count:
## # A tibble: 4 x 3## # Groups: sighted [2]## sighted forest count## <lgl> <lgl> <int>## 1 FALSE FALSE 1188## 2 FALSE TRUE 312## 3 TRUE FALSE 560## 4 TRUE TRUE 266Observed value of statistic

Null generating mechanism: Example 1
What's the null? What would be uninteresting?
ggplot(DATA) + geom_POINT( aes(x=x, y=y, colour=sighted), alpha=0.7) + extra nice stylingNull generating mechanism: Example 1
What's the null? What would be uninteresting?
ggplot(DATA) + geom_POINT( aes(x=x, y=y, colour=sighted), alpha=0.7) + extra nice styling\(H_o:\) Sightings are uniformly distributed in space
\(H_a:\) Sightings are NOT uniformly distributed in space
Null generating mechanism could be to permute the labels of sighted variable. (Or could simulated a second uniform set of points.)
Null generating mechanism: Example 2
What's the null? What would be uninteresting?
ggplot(DATA) + geom_BAR( aes(x=sighted, fill=forest), position = "fill") + extra nice stylingNull generating mechanism: Example 2
What's the null? What would be uninteresting?
ggplot(DATA) + geom_BAR( aes(x=sighted, fill=forest), position = "fill") + extra nice styling\(H_o:\) No relationship between sighted and forest habitat
\(H_a:\) Sightings in forest habitat more likely
Null generating mechanism could also be permute the labels of sighted (or forest) variable. (Or could simulate from a binomial.)
Pretend you haven't seen the data plot
Which plot is different from the rest?
set.seed(20200624)library(nullabor)l <- lineup(null_permute("sighted"), rsf1, n=6)ggplot(l) + geom_point( aes(x=x, y=y, colour=sighted), alpha=0.3) + facet_wrap(~.sample, ncol=2) + extra nice styling
Which plot is different from the rest?
set.seed(20200624)library(nullabor)l <- lineup(null_permute("sighted"), rsf1, n=6)ggplot(l) + geom_point( aes(x=x, y=y, colour=sighted), alpha=0.3) + facet_wrap(~.sample, ncol=2) + extra nice styling
You say 1? Oh, that is the data plot.
set.seed(20200625)l <- lineup(null_permute("sighted"), rsf1, n=9)ggplot(l) + geom_bar( aes(x=sighted, fill=forest), position = "fill") + facet_wrap(~.sample, ncol=3) + extra nice stylingIn which plot is the light brown bar on the right the tallest?

set.seed(20200625)l <- lineup(null_permute("sighted"), rsf1, n=9)ggplot(l) + geom_bar( aes(x=sighted, fill=forest), position = "fill") + facet_wrap(~.sample, ncol=3) + extra nice stylingIn which plot is the light brown bar on the right the tallest?

Did you say 5? You're good!
In each case, the data plot was identifiable, and the null hypothesis would be rejected
Inference for graphics infrastructure
Visual inference broadens the scope of statistics
Let's do a real lineup test
Lineup protocol
I'm going to show you a page of plots
Lineup protocol
I'm going to show you a page of plots
Each has a number above it, this is its id
Lineup protocol
I'm going to show you a page of plots
Each has a number above it, this is its id
Choose the plot that you think exhibits the most separation between groups
Lineup protocol
I'm going to show you a page of plots
Each has a number above it, this is its id
Choose the plot that you think exhibits the most separation between groups
If you really need to choose more than one, or even not choose any, that is ok, too
Lineup protocol
I'm going to show you a page of plots
Each has a number above it, this is its id
Choose the plot that you think exhibits the most separation between groups
If you really need to choose more than one, or even not choose any, that is ok, too
Ready?
01:00
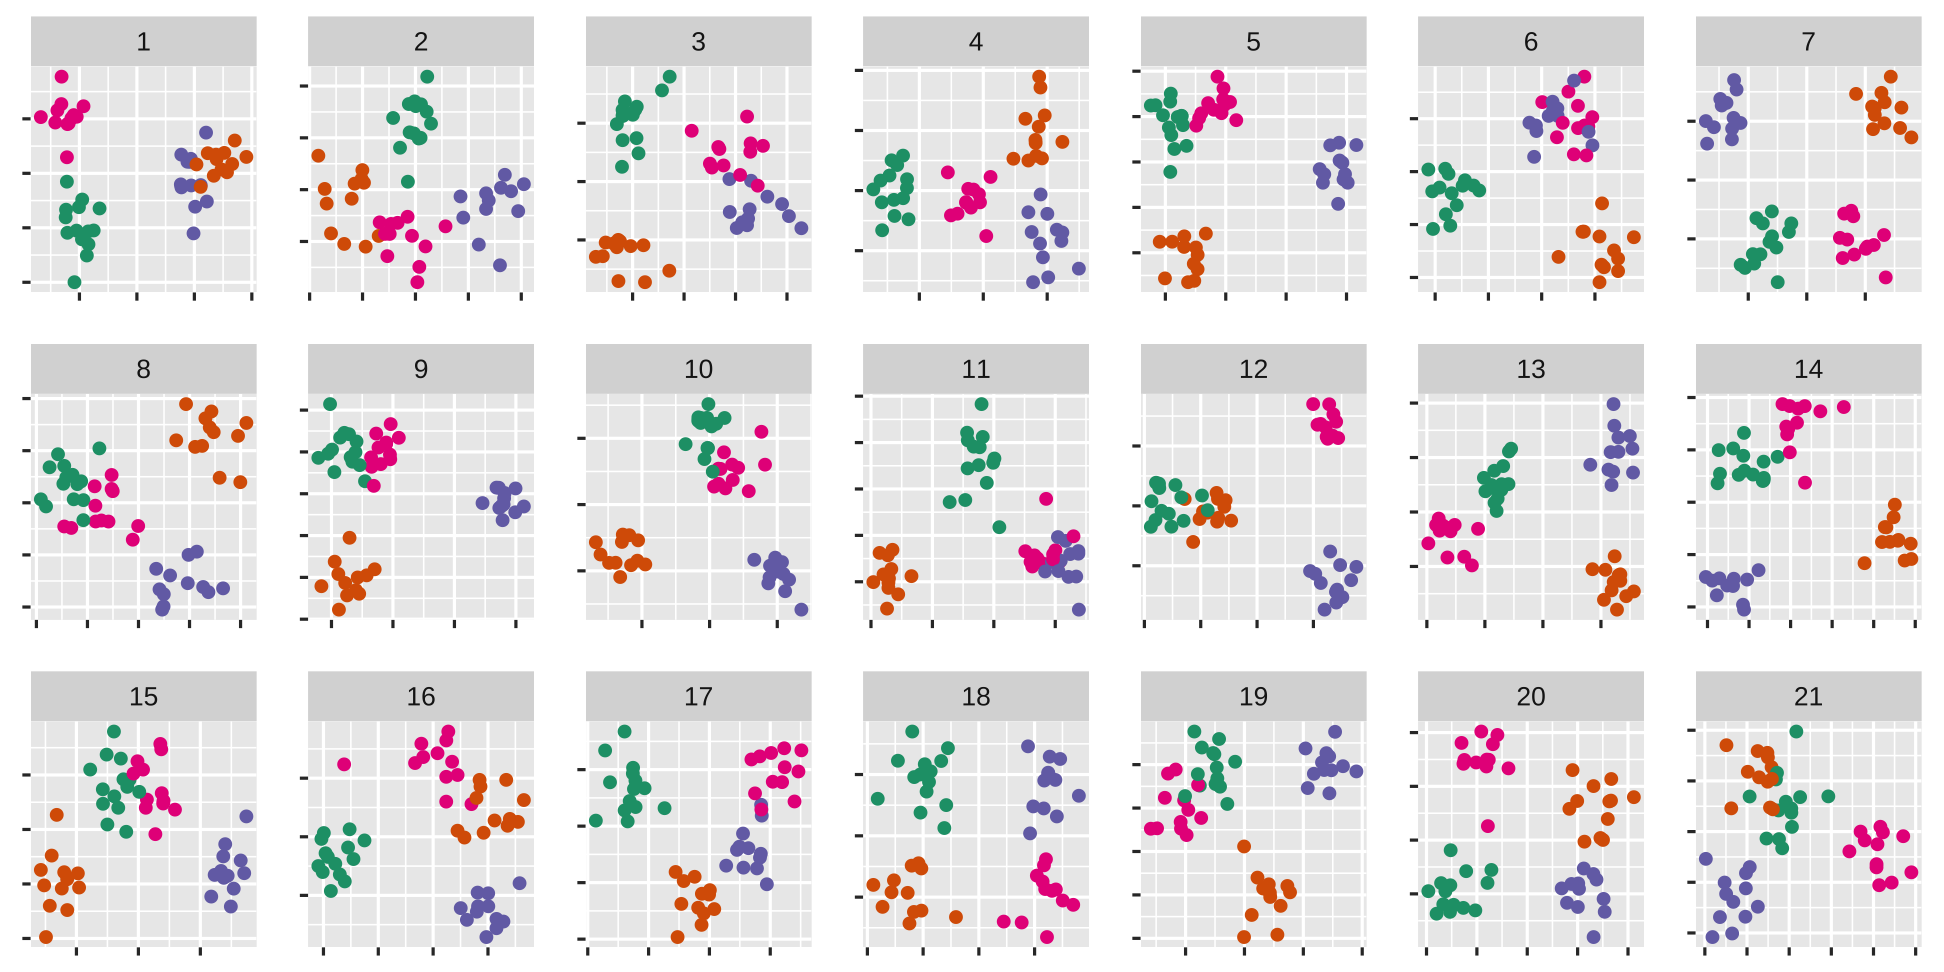
The data plot is
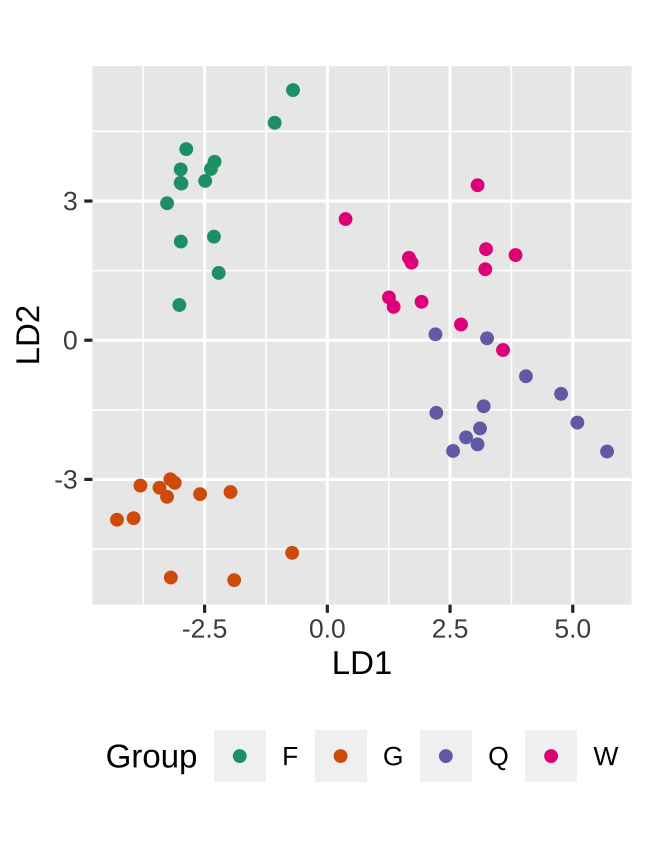
My guess is that nobody picked it?
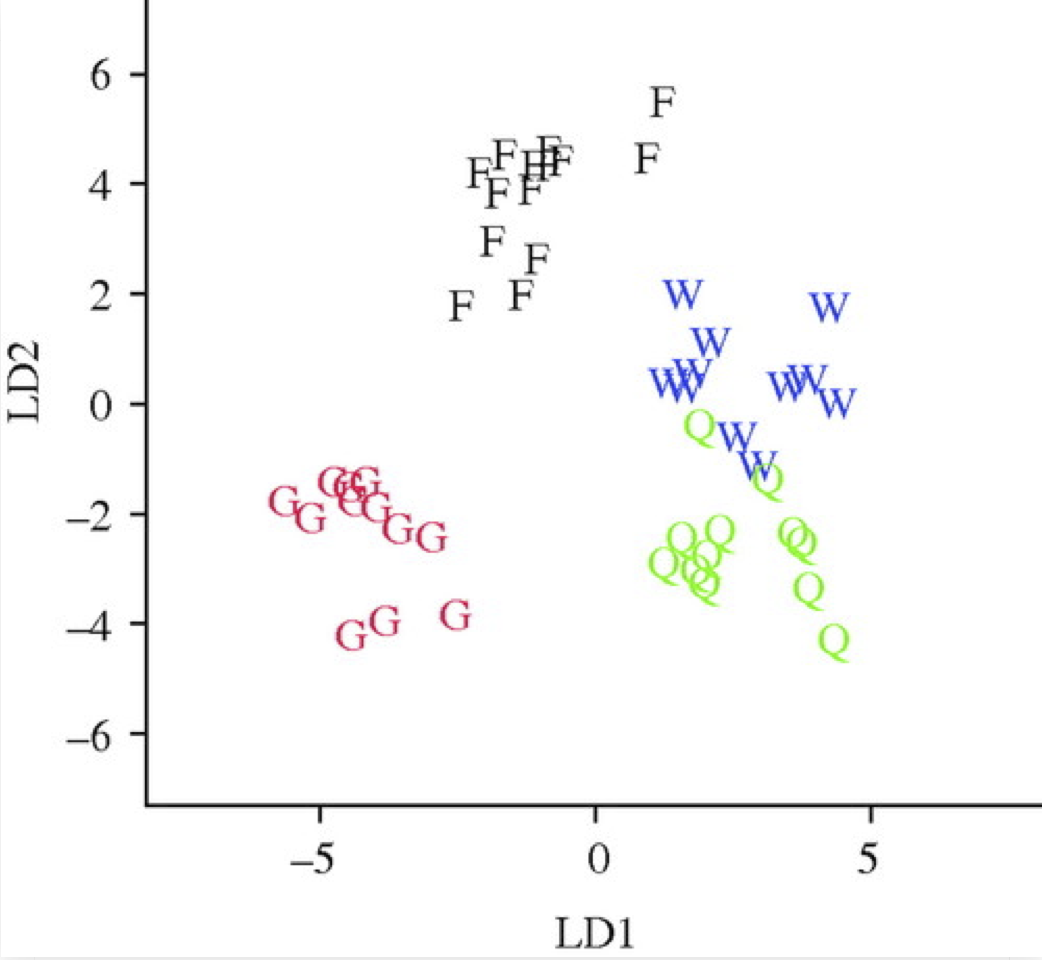
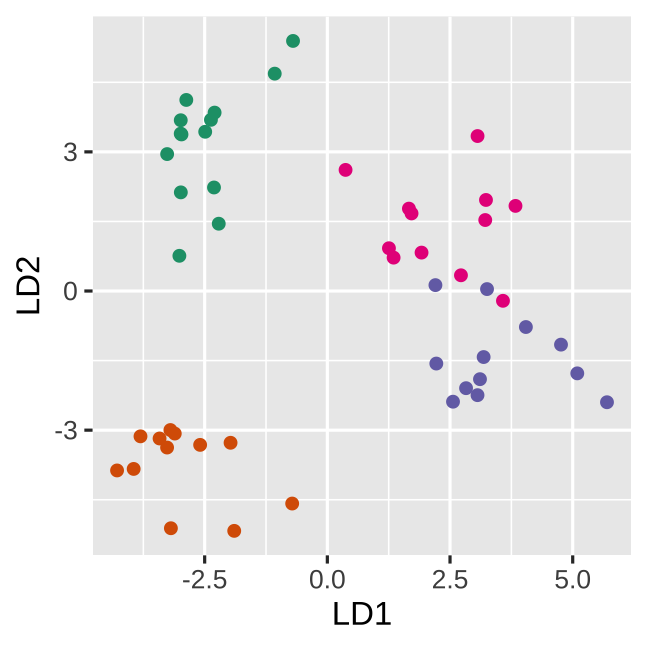
LDA resulted in ... that gynes had the most divergent expression patterns
Toth et al (2010) Proc. of the Royal Society

LDA resulted in ... that gynes had the most divergent expression patterns
Toth et al (2010) Proc. of the Royal Society
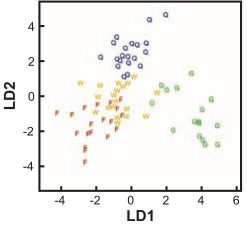
... show that foundress and worker brain profiles are more similar to each other than to the other groups.
Toth et al (2007) Science
True data
Null data
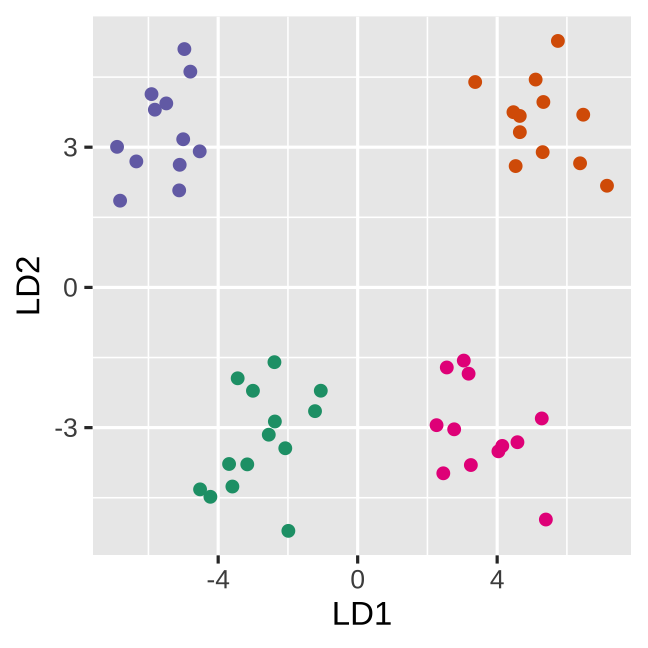
Space is big, and with few data points, classes can easily be separated
Space is big, and with few data points, classes can easily be separated
spuriously
Space is big, and with few data points, classes can easily be separated
spuriously
The lineup protocol can help people understand the problem
If you first do dimension reduction (e.g. PCA), and then LDA, the problem goes away. LDA into three dimensions shown below.
All data
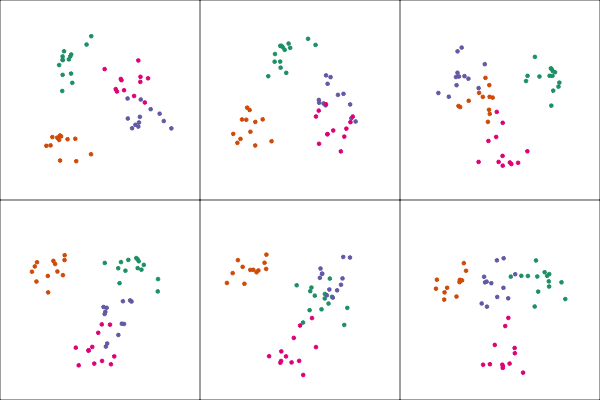
Top 12 PCs
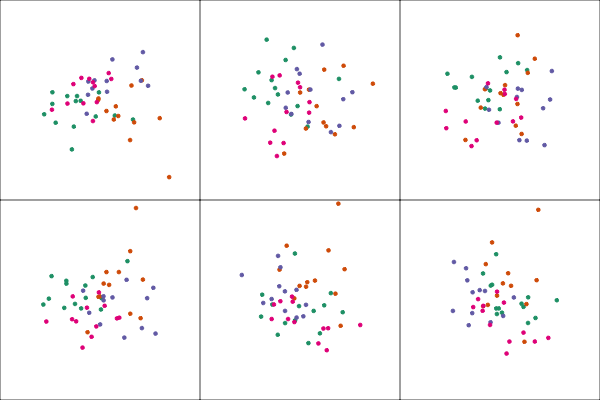
What's that you say? That people can't look at so many plots?
What's that you say? That people can't look at so many plots?
Crowd-sourcing can help here
Validation experiment
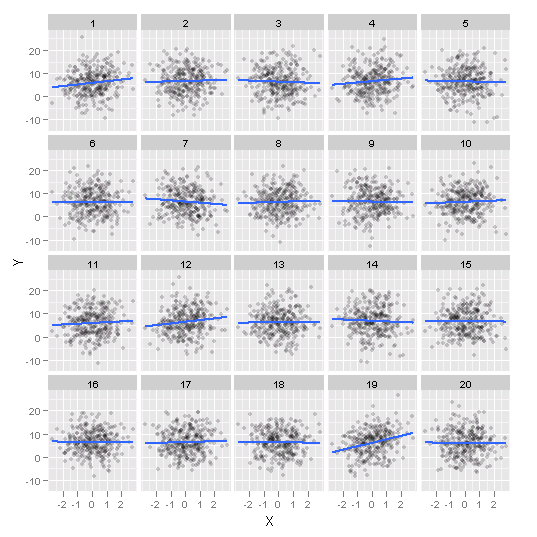
Majumder et al (2013) conducted validation study to compare the performance of the lineup protocol, assessed by human evaluators, in comparison to the classical test, using subjects employed with Amazon's Mechanical Turk.
Explanation of experiment
Read about it at http://datascience.unomaha.edu/turk/exp2/index.html
\(H_o: \beta_k = 0 ~~vs ~~H_a: \beta_k \neq 0\)
- 70 lineups of size 20 plots:
- \(n=100, 300\)
- \(\beta \in [-6, 4.5]\)
- \(\sigma=5, 12\)
- 351 evaluations by human subjects
Power analysis of human evaluation relative to classical test.
Effect \(= \frac{\sqrt{n}\times |\beta|}{\sigma}\)
Pooling the results from multiple people produces results that mirror the power of the classical test.

High-throughput analysis
😓
The wasps example made us worried about our own RNA-Seq analyses!
Lineup of our own data
I'm going to show you a page of plots
Lineup of our own data
I'm going to show you a page of plots
Each has a number above it, this is its id
Lineup of our own data
I'm going to show you a page of plots
Each has a number above it, this is its id
Choose the plot that you think exhibits the
- steepest green line
- with relatively small spread of the green points
Lineup of our own data
I'm going to show you a page of plots
Each has a number above it, this is its id
Choose the plot that you think exhibits the
- steepest green line
- with relatively small spread of the green points
Ready?
Experimental design 2x2 factorial:
- Two genotypes (EV, RPA)
- Two growing conditions (I, S)
- Three reps for each treatment
- Approx 60,000 genes
Results from two different procedures, edgeR and DESeq provided conflicting numbers of significant genes, but on the order of 300 significant genes.
One of the top genes was selected for the lineup study, and independent observers engaged through Amazon's Mechanical Turk.
How does a
discrepancy
happen?
Turk results
Is there any significant structure in our data?
Turk results
Is there any significant structure in our data?
- 24 lineups were made, only one shown to an observer
- 5 different positions of the data plot
- 5 different sets of null plots
Pooling results gave a detection rate of 0.65, which is high. There is some structure to our data.
Two aspects of massive multiple testing
- ruler on which to measure difference === empirical Bayes
- false positives === False Discovery Rate
Two aspects of massive multiple testing
- ruler on which to measure difference === empirical Bayes
- false positives === False Discovery Rate
Even with these, mistakes can happen, and visualising the data remains valuable
Bring on deep learning, and computer vision models
💻
Monash Masters thesis by Shuofan Zhang
Starting from Majumder's validation study data:
\(H_o: \beta_k = 0 ~~vs ~~H_a: \beta_k \neq 0\)
Linear vs no relationship (null)
Training the deep learning model
Same process, but with broader range of parameter settings, and a lot more data!
200,000 samples from each of linear and null scenario generated
\(\beta_1\sim \pm U[-10, -0.1]\) (linear, null when \(\beta_1=0\))
\(\sigma \sim U[1,12]\)
\(n=U[50,500]\)
Computer model prediction
- Re-generate the 70 data plots using the same data in Turk study (without null plots)
- Use the computer model to predict whether the 70 data plots were "linear" or "null"
- The computer model's predicted accuracy over the 70 data plots are recorded as the model's performance.
Human subjects results
- Calculate \(p\)-value associated with each lineup using the binomial formula (from Majumder), with \(N\)=number of evaluations and k=number of people choosing data plot
- Draw conclusion: reject the null when the calculated \(p\)-value is smaller than \(\alpha\).
- The accuracy of the conclusions over the 70 lineups
Repeat of experiment
Using same sample of \(n\), \(\beta\), \(\sigma\), new data generated, and images created numerically by binning (to 30x30 pixels), counting and scaling counts to 0-255.
Keras model fitted with 60,000 training images for each class, linear and not.
Accuracy with simulated test data, 93%. Null error 0.0179, linear error 0.1176
Code available in the file keras_correlation.r
Its blindingly fast!
Accuracy

Humans beat computers.
Accuracy

Humans beat computers.
Power analysis
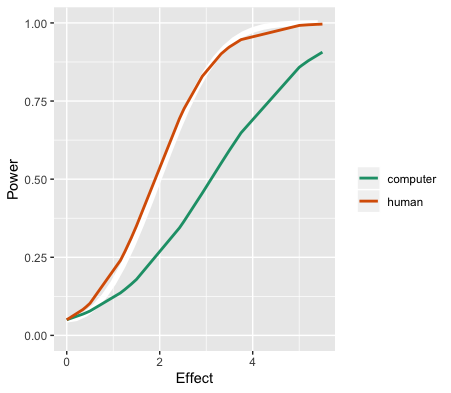
Humans beat computers.
Comparison of human and computer.
| Computer | |||
|---|---|---|---|
| Not | Linear | ||
| Human | Not | 27 | 0 |
| Linear | 15 | 28 | |
Computer tends to predict too many as "not linear".
Thanks for listening!
Here's what I hope you heard:
- Plots can be embedded into an inferential framework
- This extends the applicability of statistics to more complex problems
- Crowd-sourcing can help mange plot evaluation
- Computer vision models are promising ways to scale up
Additional reading
^ Buja et al (2009) Statistical Inference for Exploratory Data Analysis and Model Diagnostics, RSPT A
^ Wickham et al (2010) Graphical Inference for Infovis, TVCG
^ Hofmann et al (2012) Graphical Tests for Power Comparison of Competing Design, TVCG
^ Majumder et al (2013) Validation of Visual Statistical Inference, Applied to Linear Models, JASA
^ Yin et al (2013) Visual Mining Methods for RNA-Seq data: Examining Data structure, Understanding Dispersion estimation and Significance Testing, JDMGP
^ Zhao, et al (2014) Mind Reading: Using An Eye-tracker To See How People Are Looking At Lineups, IJITA
^ Lin et al (2015) Does host-plant diversity explain species richness in insects? Ecological Entomology
^ Roy Chowdhury et al (2015) Using Visual Statistical Inference to Better Understand Random Class Separations in High Dimension, Low Sample Size Data
^ Loy et al (2017) Model Choice and Diagnostics for Linear, CS
Mixed-Effects Models Using Statistics on Street Corners, JCGS
^ Roy Chowdhury et al (2018) Measuring Lineup Difficulty By Matching Distance Metrics with Subject Choices in Crowd- Sourced Data, JCGS
Acknowledgements
Slides created via the R package xaringan, with iris theme created from xaringanthemer.
The chakra comes from remark.js, knitr, and R Markdown.
Slides are available at https://dicook.org/files/vISEC2020/slides.html and supporting files at https://github.com/dicook/vISEC2020.

This work is licensed under a Creative Commons Attribution-ShareAlike 4.0 International License.
Image credit: Di Cook, 2019